When it comes to finding chart patterns to trade, many traders think it’s just a game of luck.
And time and time again, they try to be “lucky” by using the latest indicator or technical indicator.
But without a solid trading methodology, it’s nearly impossible to succeed consistently. Consistency is essential if you want to get funded as a trader.
Chart patterns are powerful tools that can help you make profitable trades in the stock market.
The problem is, you have to be careful which patterns you use because there are dozens of patterns out there.
So how can you make sure you find the right pattern at the right time?
That’s why I wanted to teach you how to find chart patterns to trade – the right way.
In this article, you’ll learn about seven chart patterns that I follow every day and the beginners swing trading strategies. They are simple patterns that you can use to identify trends in the stock market.
So don’t wait up! Let’s get started!
Breakout Patterns
The breakout chart pattern is one of the most common patterns found in technical analysis and is a classic example of chart patterns.
The breakout chart pattern occurs when a stock or index breaks out of a pattern it has found resistance or support in the past.
For instance, a stock or index may break out of a trading range by closing above resistance or closing below support.
A breakout occurs when the price of a security moves past a key level in an uptrend or downtrend.
Each breakout pattern is unique and usually indicates a change in momentum or direction of the security.
In technical terms, a breakout occurs when a stock or index moves higher than its 50-day moving average and its 200-day moving average.
When the breakout occurs and the price closes near the top of the opening gap, it indicates a shift in momentum from a downtrend to an uptrend.
The breakout chart pattern is widely popular because it works most of the time, but that’s not to say it is always profitable.
You need to analyze a stock or index’s chart to see if there is any bearish or bullish divergence that could indicate a breakout will occur soon.
Often, traders like to use breakouts as an entry point into an existing position or as a signal to take a position.
Consolidation Chart Patterns
A consolidation chart pattern occurs when the price moves sideways between two parallel support and resistance areas before moving higher.
Consolidation patterns can form in a variety of different ways. Sometimes the price will consolidate after a breakout of a trend channel and sometimes the price will consolidate after a breakout of a chart formation such as a symmetrical triangle.
Consolidation patterns often precede a bigger move higher so it’s common to see bigger price moves after a consolidation pattern has formed.
To recognize a consolidation chart pattern, look for the price to move sideways between two parallel support/resistance areas before breaking out in one direction or the other.
Some common examples of consolidation patterns are wedges, pennants, and flags.
Reversal Chart Patterns
Reversal chart patterns are reversal patterns that occur after a stock’s price has traded in one direction for a significant period of time.
Reversal chart patterns can occur before the stock reaches its resistance or support level, or if they have already reached the resistance or support level.
Reversal chart patterns occur because a stock has gone in one direction and may have traded sideways for a period of time before reaching a resistance level.
If the stock price does not reach that resistance level, then the stock charts will reverse and resume their upward or downward trends.
Since reversal chart patterns occur after a significant period of time of trading in one direction, they are statistically reliable patterns.
Ideally, a reversal chart pattern occurs after a significant price movement in the opposite direction.
If a company’s stock price has fallen for a significant period of time, then the stock may reverse and start to rise again.
On the other hand, if the company’s stock price has risen for a significant period of time, then the stock may reverse and start to fall again.
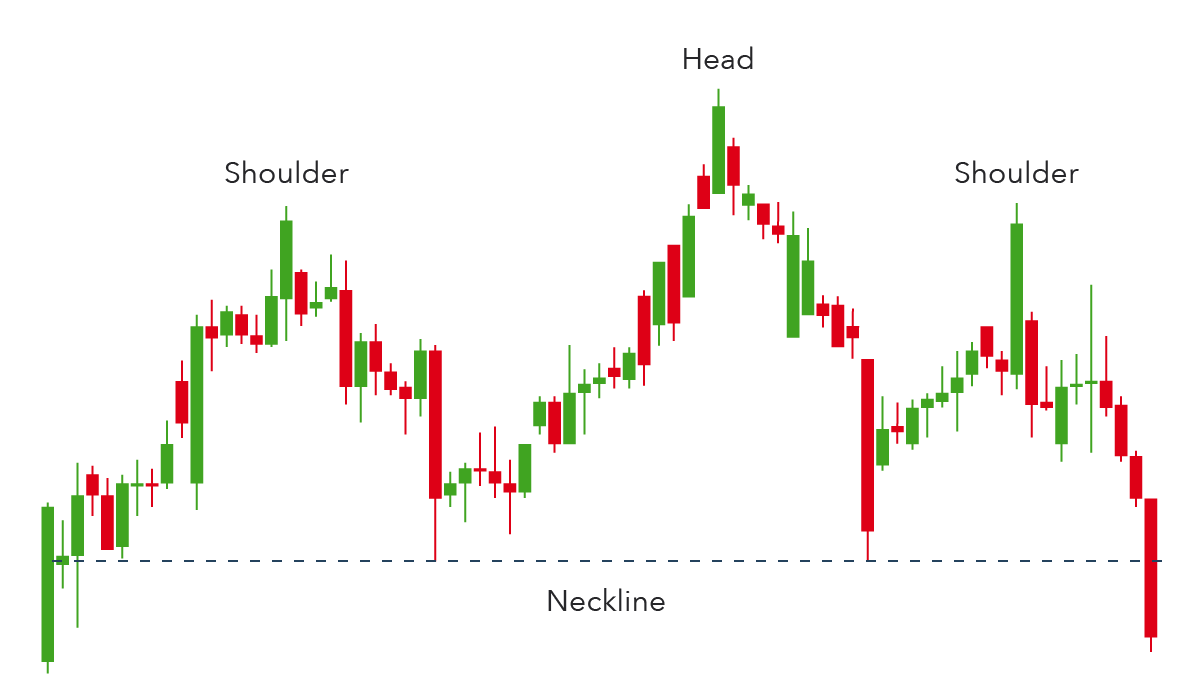
Reversal chart patterns can be based on many different chart patterns, such as the head and shoulders pattern, double top and triple top patterns, and patterns based on Fibonacci retracement levels.
For example, a diamond top pattern is a bearish reversal chart pattern that occurs when a stock makes a new high and then reverses lower to form a bearish triangle.
When you find a diamond top forming in an uptrend, you know that the stock price is likely to fall in the near future.
By understanding how chart patterns work, you will recognize when the stock is forming a bullish or bearish pattern and when you should buy or sell it for profit.
Chart Pattern Trading Tips
1. Have Patience
Price charts give us plenty of signals including candlestick patterns, trend lines, support and resistance levels, and Fibonacci retracements.
These patterns give us multiple opportunities to enter and exit trades but you must be patient and wait for the right setup.
The biggest mistake traders make is jumping in on an initial signal instead of the follow-through signals that come after.
Be patient and close out your position when the initial signal is no longer valid.
2. Trade within your Comfort Zone
Everyone has a comfort zone when it comes to trading. It’s different for every person.
For some, it’s $100 per trade. For others, it’s $1,000 per trade. Everyone has their own comfort zone. It is different for everyone.
It’s important to realize that even the best traders will have losing trades. It’s part of the game of trading.
At some point, you need to leave your comfort zone and trade bigger amounts. That’s the only way to become successful at trading.
I try and trade amounts that make me nervous. If it makes me nervous, then I know that I’m probably right when I’m trading it.
3. Make Sure You Have Enough Money to Trade
Before you ever start trading, you need to have enough capital to trade. So how much capital do you need? Well, that depends on what your trading style is.
For instance, if you swing trade, then you’ll need a bit more money per trade than if you were day trading.
You also need to make sure you have enough capital to trade through losing streaks.
For instance, if you day trade and your first trade of the day loses, you need to make sure that you have enough money to trade the next day.
If you day trade and the first trade loses, you have $ 1,000 in your account and you lost $200 on that loss, you don’t have enough funds to trade again that same day.
You would have to make at least $300 on your next trade just to break even for the day. So you need to make sure you have enough money in your account to trade through losing streaks.
4. Trade with Proper Discipline
Unfortunately, many traders lose a lot of money because they don’t respect the rules of the market. Trading is a high-risk business.
You need to make sure that you trade with proper discipline and follow the rules of the market.
The discipline you apply to your trading will make or break you as a trader. You must strictly follow your rules 100% of the time in order to succeed as a trader.
When you’re not following your rules, you’re likely to lose money in the market which will lead to more losses in the future if you’re not careful with your discipline.
5. Avoid Overtrading
While trading is exciting, and in theory easy, it can also be frustrating at times because losses are part of the game.
When dealing with a small account, it’s very important not to overtrade and risk more capital than you have.
The key to success with a small account is to limit the risk per trade to an amount that’s reasonable and acceptable to you.
You will also want to set a maximum amount of trades per day or per week to limit the number of trades you execute.
There’s nothing wrong with trading 2-3 times per day, or even 4-5 times per week if you have a big account and don’t mind risking a lot on each trade.
6. Learn The Basics of Technical Analysis
Technical analysis is the study of the patterns and trends that occur in the stock market.
To become a successful trader you must have a technical trading plan that incorporates various charts and patterns to form a trading strategy.
A fundamental analysis trader might look at a company’s income statement and balance sheet to determine the value of that company. However, a technical trader will look at a stock’s chart and study patterns to determine if it’s trending up or down.
A technical trader may use various technical indicators to help confirm a move whether it’s bullish or bearish.
The technical trader might also use fundamental analysis as part of a trading strategy.
For instance, a technical trader may decide that a company is undervalued because it trades at a low multiple to its earnings or sales.
They may look at the company’s income statement and its recent earnings history and determine that the stock could be bought cheaply and holds promise for growth in the future.
7. Manage Your Emotions
Trading is an emotional game and your emotional control is your biggest liability.
As a new trader, you must develop a strong mindset and money management techniques. You need to cut out emotional trading at all costs.
Emotional trading is when a trader trades based on emotion rather than logical, analytical reasoning.
For instance, a trader might open a short trade on EUR/USD because he believes the market is down.
But, the market is actually up and he also opens a buy trade on EUR/USD. He opens the buy trade because he’s scared to sell EUR/USD because he missed another great opportunity.
The trader ends up getting stopped out on both trades at the exact same time. Thinking only about his loss, he then decides to buy EUR/USD again the following day to “get even”.
The trader ends up losing both trades and loses $500 in a day. The trader then decides that he can’t afford to lose any more money and decides to close his account.
The trader then blames his loss on losing his nerve and not being able to trade anymore because he’s too scared and doesn’t want to be up $500 if he makes another small mistake. The trader then blames his loss on the lack of discipline in not placing his stop loss.
Emotions are a normal part of trading but it’s important to control them so you can stay focused and not let greed or fear take over your trading decisions.
The only way to control your emotions is to be completely aware of them and realize that they exist.
When you become conscious of your emotions, you can recognize them before they take control of you.
The fastest way to make money is through fear. The fastest way to lose it is through greed. Therefore, it’s important to manage emotions so they don’t affect the way you trade.
8. Diversify Your Portfolio
As a new investor, it’s important that you don’t put all of your eggs in one basket.
You’ve heard it before: “diversify your portfolio.” But what does that mean? Can you diversify your portfolio 100%?
The answer is no! You can diversify your portfolio by industry, sector, geography, size, style, company, and so on.
But you cannot diversify your portfolio 100%. Why? Because every stock is going to be a part of some industry. So, how can you diversify your portfolio?
To answer this question, you need to ask yourself, “What does my stock portfolio represent?” If it represents your retirement plan, then you need to diversify your portfolio by company size.
If it represents your view of the current market environment, then you need to diversify your portfolio by sector.
If it represents your view of the stock market in general, then you need to diversify your portfolio by style.
With the stock market constantly fluctuating, it’s important that you have different asset classes in your investment portfolio to help protect yourself against losses when stocks go down as well as help you make money when stocks go up.
Final Words of How to Find The Right Chart Pattern for Trading The Stock Market
Chart patterns occur in the market all the time but finding the pattern that works for you takes patience.
Trading stocks is a very personal thing and what works for one trader might not work for the next.
Here are some general guidelines that can help you find a pattern that works for you.
First, when you’re starting out, it’s best to be a swing trader and not a day trader. Swing traders hold stocks for days or weeks at a time and day traders hold stocks for minutes or hours at a time. (xanax)
Second, don’t focus too much on the chart pattern itself. Instead, focus on finding stocks that have shown similar chart patterns in the past.
Third, chart patterns can be categorized in several ways. They can be breakouts or breakdowns, continuations, reversals, and double tops and bottoms to name a few.
Finally, once you find a chart pattern you like, don’t try to reinvent the wheel. Instead, learn how the stock you’re trading has performed in the past based on the chart pattern you discovered.